


The software only works with Windows 10 or older, and looks a bit outdated, too. Also missing elementary funktions like zooming the Graph not only on the time scale, but also on the measurement scale. For Example, if you like to view a signal that changes between 40 and 41 Volts, you wont get a nice graph as the y-axis always goes from 0 to 50 or such and you cant change that.
Maybe its better with another software. Basically it works.
Brymen BU-86X USB kit
Details
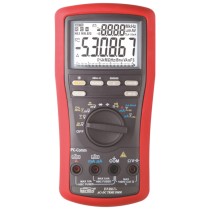
This Brymen BU-86X is an USB kit & software (download) for the Brymen multimeters. With this kit a PC can be used to read out the meter, and store data if necessary. This kit is applicable for the following models:
- Brymen BM525s - BM521s
- Brymen BM829s - BM827s - BM822S - BM821s
- Brymen BM869s - BM867s
Similar products





